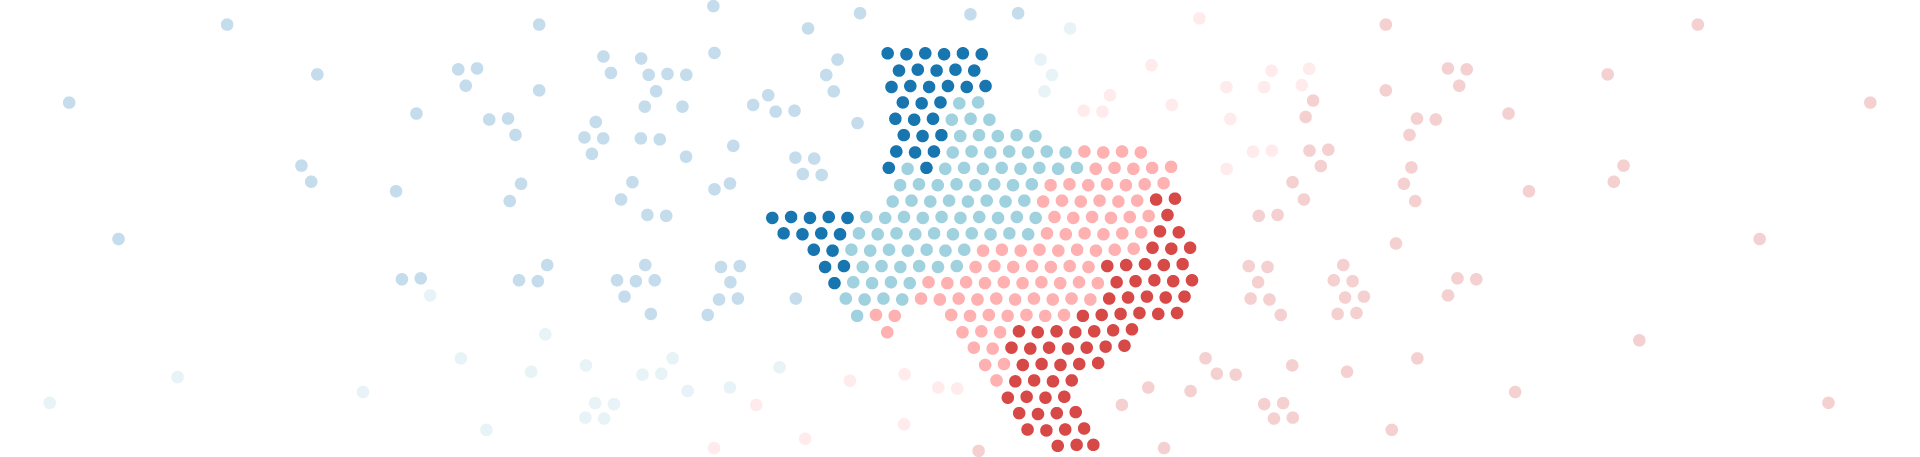
Is Texas really going purple? Our Heat Index shows how competitive your district was — and is.
The 2020 elections will be an acid test for Texas politics. Did the results in 2018 mark a new trend toward more competitive general elections or a one-time swerve away from the steady quarter-century pattern of Republican dominance?
To answer that question, we looked beyond who currently represents each congressional or legislative district and created our own Heat Index — a measure of whether each district generally favors Democrats or Republicans in statewide elections. Statewide elections are those from president down to the top courts in Texas — races decided by all Texas voters, and not just some of them.

Here is how we calculated the Heat Index
For each congressional and legislative district:
Average percentage vote for
Republican statewide candidates
Average percentage vote for
Democratic statewide candidates
Heat Index =
—

Here is how we calculated
the Heat Index
For each congressional and
legislative district:
Heat Index =
Average percentage
vote for Republican
statewide candidates
Average percentage
vote for Democratic
statewide candidates
—
This is a better way to explore the politics of the districts. Here’s why: Seats will sometimes flip for unusual reasons — a lackluster candidate, a scandal or issues having little to do with who’s on the ballot. Looking at how each party fares on average in a district in statewide races ignores that noise to highlight broader political trends.
Take a look at how the Heat Index has changed in some of Texas’ congressional, state House and state Senate districts over the last 18 years. Then look up how the districts where you live have changed.
Here’s how the Heat Index classified all of Texas’ 36 congressional districts for 2018.
This is how the congressional districts break down, with red dots representing districts where Republicans dominated in statewide races in 2018 and blue dots representing Democratic districts.
Congressional elections take place every two years. But because of redistricting (and in some cases, the popularity of an incumbent), most of those races are not competitive in November general elections.
The 2018 elections were among the most competitive in Texas in years. Here’s how it broke down:
The number of competitive congressional districts in Texas jumped dramatically in 2018. Ten districts were either highly competitive — “hot” on our charts — or competitive — “warm.” That’s up from just one in 2016. The number of districts that moved into competitive range suggests Texas could be a battleground for both parties in 2020.
Sprawling across West Texas, the 23rd Congressional District is one true swing district on the state’s congressional map. Both Democrats and Republicans have represented the area over the last 20 years, and it rated as “warm” or “hot” — based on average statewide results — in seven of those elections. The district leaned Democratic in 2018, but the winner, U.S. Rep. Will Hurd of Helotes, is a Republican.
The patterns are similar in the state Legislature. This is how the 31 Texas Senate districts are divided.
Senators’ terms last four years, and elections are staggered: 16 one election year, 15 the next. As with congressional districts, most of those races are not competitive in November general elections.
The number of competitive Senate districts in Texas rose in 2018 — to five that were either “hot” or “warm” from three in 2016.
The race to watch in 2020 is in the 19th Senate District. Our Heat Index classifies it as favoring Democrats, yet it’s currently represented by a Republican, Pete Flores of Pleasanton.
These dots represent the 150-member Texas House of Representatives.
House members serve two-year terms, and all of their seats will be on the ballot in 2020. As with congressional and Senate seats, most of those races aren’t competitive in November general elections.
Because the House has so many districts and because each district is relatively small, it offers the best illustration of the increasing competition in Texas general elections. In 2018, a total of 31 districts were rated “hot” or “warm” in the Texas House, the most in the last two decades.
The 66th House District in Collin County, represented by Matt Shaheen, R-Plano, has been safe territory for Republicans for years. In five of the last nine elections, it’s been highly uncompetitive. But in average results in statewide races, it moved dramatically in 2018 — all the way over to “hot.”
Search for your districts
Search here for the congressional and legislative districts that go with your address and see how they’ve performed over the last nine election cycles in Texas.
Search for your districts
Search here for the congressional and legislative districts that go with your address and see how they’ve performed over the last nine election cycles in Texas.
Methodology
To explore political patterns over time, we analyzed election results and reports from the Texas Legislative Council, a state agency that helps the Legislature draw political maps. TLC’s work lets us examine almost 20 years of elections as if the current congressional and legislative maps had been in place the whole time, ignoring redistricting that took place in the interim. The dots in our charts represent which party dominated, on average, in competitive statewide races in each district in general elections from 2002 to 2018. For each year, we added up the percentage of votes given to the Republicans in all of the statewide races and averaged them, then did the same with the Democratic candidates. The Heat Index represents the difference between the Republican average and the Democratic average, by district.
Darla Cameron, Aman Batheja and Ryan Murphy contributed to this story. Illustration by Emily Albracht.